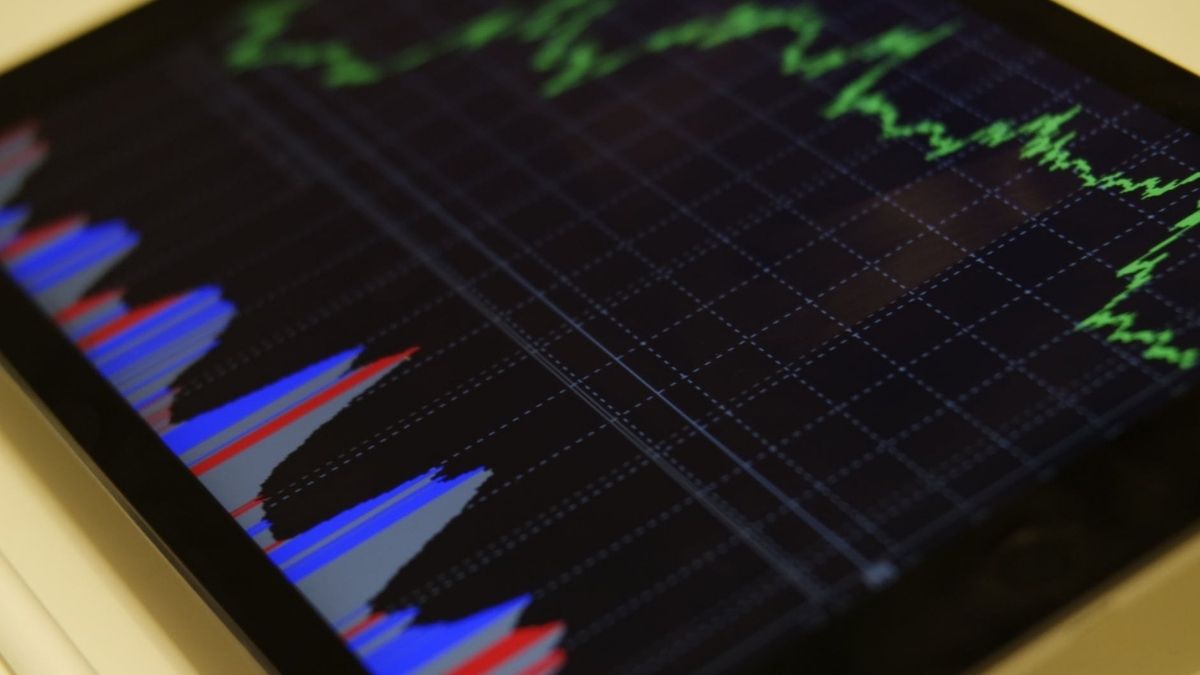
Five Most Popular Indicators In Forex Market

Indicators are one of the most essential tools when it comes to trade execution. Starting with the experienced traders in Hong Kong and ending with the rookie traders, everyone uses the indicators to find quality trades. Though the pro traders know the perfect way to use the indicators the inexperienced traders always make things complicated while using the indicators. You can try this out.
In fact, they overload their trading charts and loses a big portion of their investment by using a complex trading strategy. As a currency trader, you should never use more than two indicators to filter out the best trades. So, which indicators should you use? To be honest, the answer greatly depends on your trading style and mentality. However, we are going to highlight the five most popular indicators used by the pro traders so that you can pick the best ones for you.
These five indicators are:
Forex Market
- Stochastic
- RSI
- Bollinger band
- SMA
- ADX
Stochastic indicator
Stochastic is an oscillator and it helps the traders to find the overbought and oversold condition of a certain asset. Those who are completely new should definitely use this indicator in the higher time frame since they always generate early signals. To be precise, you need to analyze the higher time frame data when you deal with a leading indicator. Trading the major pairs is really easy but when it comes to cross pair trading strategy you need to tweak the settings of this indicator.
RSI indicator
RSI stands of Relative Strength Index and its function is pretty similar to the stochastic indicator. So, why do you need to use the RSI indicator instead of stochastic? It greatly depends on the trader’s mentality. In a sense understanding the reading of an RSI indicator is fairly easy. If the curve stays near the 30 mark, you need to look for a buying opportunity. On the other hand, if the reading is near the 70 mark, look for short trade setups.
Bollinger band indicator
Everyone loves to use the Bollinger band indicator. If you want to become successful in your Forex trading profession, you must learn the use of this indicator. The indicators have three major curves. The upper curve is now known as the upper band and its act as a critical resistance level. The lower curve is known as the lower band and it acts as a critical support level. The pro traders execute long on short orders at the dynamic level of this indicator by using the simple price action confirmation signal. But always remember, in order to get a better result from this indicator, you must use it in a higher time frame.
Simple Moving Average (SMA)
Understanding the simple moving average, often known as SMA, is a very complex task. But if you use the 100 day SMA you can easily find great trades at any market condition. The 100 day SMA acts as a dynamic support and resistance level. Most of the time the price of a certain asset respects this level and creates unique scalping opportunity. The experienced traders often use it to execute long term trade by using the complex candlestick patterns. Before you start to trade the market by using the 100 day SMA, make sure you have complete knowledge of the price action trading strategy. If not, use the demo account to master a price action trading strategy to trade the SMA.
ADX indicator
ADX stands for average direction movement and it is widely used by the experienced traders to find the trend reversal signals in the market. If the +DI curve crosses below the –DI curve you need to prepare yourself for a bearish reversal signal. On the contrary, if the +DI crosses above the -DI curve it’s a bullish reversal signal. Before you start to use this indicator, make sure you use a demo account to understand how the indicators react to different market conditions.


